tile.gs
Name
tile - Draw tile (hatch).
Synopsis
tile
    ( var ( min max | -min min | -max max ) | varmin varmax )
    [-type type] [-int int] [-thickness thickness] [-color color]
Description
Available from GrADS 2.1 or later. To show help, simply run "tile".
Note
If you draw different tiles twice or more and save by printim, then all the tiles are drawn by the last tile setting. I suspect the bug in GrADS.
Options
- var
- Name of variable to draw tile (only for 2-D chart).
- min, max
- Value range to draw. Default range is [-1e+30:1e+30] (essentially infinity).
- varmin, varmax
- Names of Minimum and maximum variables to draw (only for 1-D chart).
- type
- Type of tile. Default value is 5.
- int
- Integer value of tile interval. Default value is 9.
- thickness
- Tile line thickness. Default value is 3.
- color
- Tile color. Default value is 1.
Examples
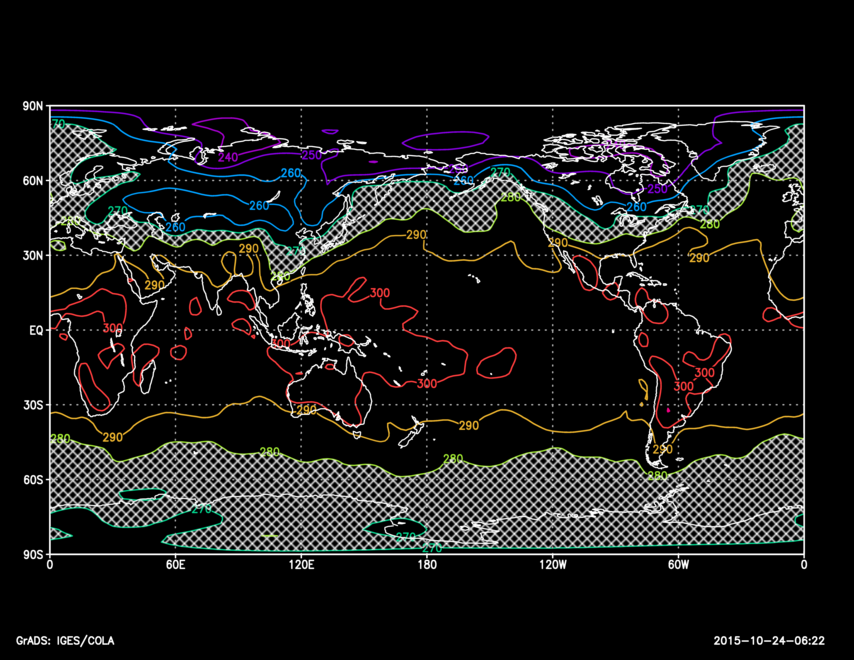
(1) Draw tile on lat-lon figure.
ga-> open t.ctl
ga-> d t
ga-> tile t 270 280

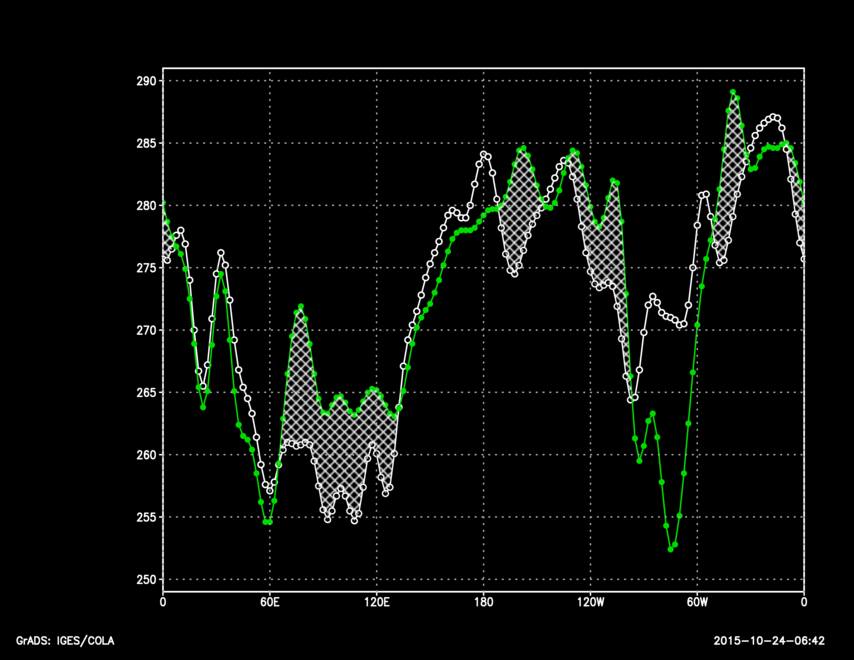
(2) Draw tile vertical hatch on lat-time figure.
ga-> open t.ctl
ga-> set lat 45
ga-> d t
ga-> d t(t=10)
ga-> tile t t(t=10)


