hatch.gs
- Note: Since GrADS 2.1 or later supports tile, this script will be removed in future. Use tile.gs, which is almost equivalent to hatch.gs
Name
hatch - Draw hatch.
Synopsis
hatch
    ( var ( min max | -min min | -max max ) | varmin varmax )
    [-angle angle]
    [-density density]
    [-int int]
    [-color color]
    [-type type]
    [-thickness thickness]
Description
To show help, simply run "hatch".
Options
- var
- Variable.
- min, max
- Value range to be drawn (default: [-1e+30:1e+30]).
- varmin, varmax
- Variable range (only for 1D chart).
- angle
- Anti-clockwise angle of the hatch (default: 45). hatch is parallel to +X axis when angle=0. You can specify two or more angles by comma-separated values, e.g., -angle 45,90.
- density
- Density (or accuracy) of the hatch (default: 0.01).
- int
- Hatch interval (default: 0.1).
- color
- Hatch color (default: 1).
- type
- Hatch line type (default: 1).
- thickness
- Hatch line thickness (default: 1).
Examples
(1) Draw hatch on lat-lon figure.
ga-> open u.ctl
ga-> set lev 500
ga-> set lat -90 90
ga-> set lon 0 360
ga-> d u
ga-> hatch u 20 100
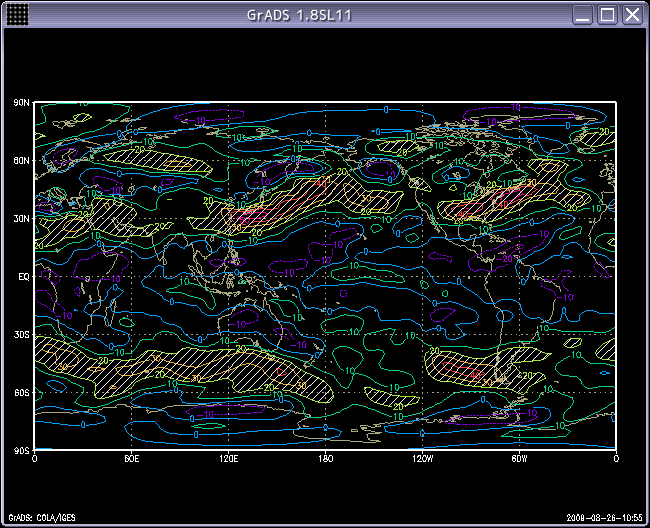
(2) Draw vertical hatch on lat-time figure.
ga-> open t.ctl
ga-> set t 1 12
ga-> set lat 0 90
ga-> set lon 0
ga-> d t
ga-> hatch t 280 290 -angle 90
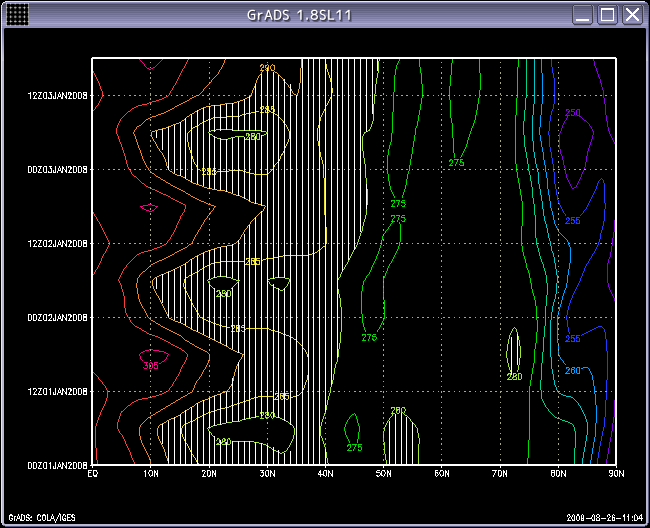
(3) Overlap hatch.
ga-> open t.ctl
ga-> d t
ga-> hatch t 200 270 -angle 45,135
ga-> hatch t 300 320 -angle 0,90
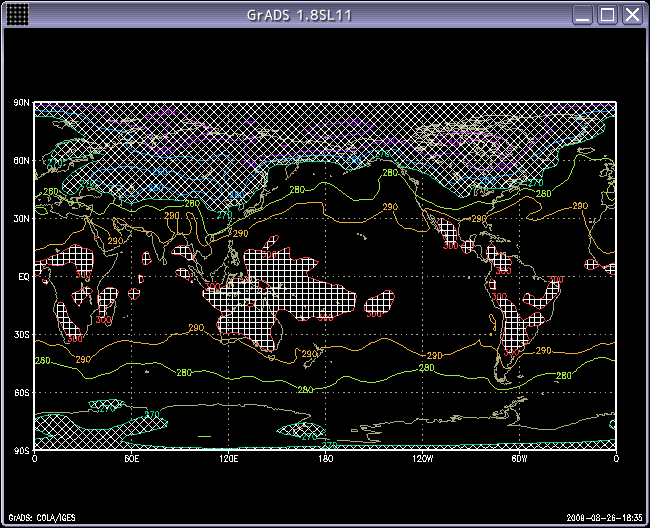
(4) Draw hatch on 1D figure.
ga-> open hgs.ctl
ga-> set lat 30
ga-> d hgs
ga-> hatch hgs 1000 6000 -color 2
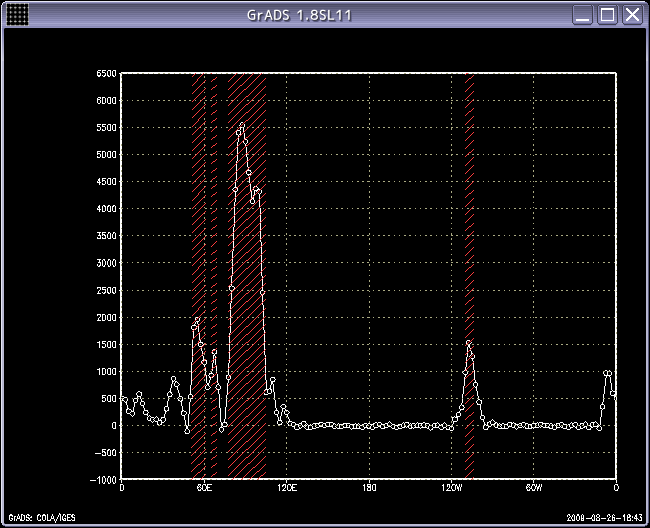
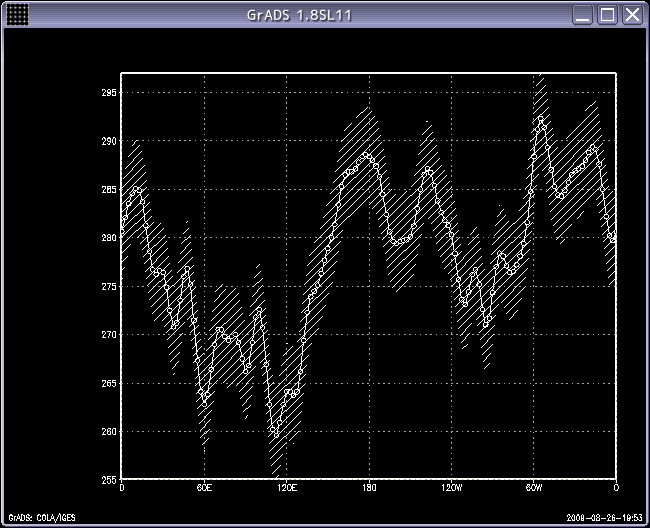
(5) Draw hatch on 1D figure like linefill.
ga-> open t.ctl
ga-> set lat 40
ga-> d t
ga-> hatch t-5 t+5
Script source code
- hatch.gs (necessary)

