draws.gs
名前
draws - 図に対する相対位置を指定して文字列を表示する。
概要
draws
   ( [-by figure] [-pos position] [-base base]
   | -by (world | grid | xy) xpos ypos )
    [(-xoffset | -xo) xoffset] [(-yoffset | -yo) yoffset]
    [-color color] [-setfont size] [-angle angle]
    string
説明
引数なしで実行するとヘルプが表示されます。
引数
- -by type
- 座標系の種類。"figure" (図に対する相対位置), "world", "grid", 又は "xy"。デフォルト値は "figure"。
- -pos position
- 文字列を表示する位置。-by figure 時のみ有効。デフォルトは "tc"。
- -base base
- positionに対する文字列の基準位置。-by figure 時のみ有効。
- xpos, ypos
- 位置。
- (-xoffset | -xo) xoffset
- 水平方向のオフセット(調整値)。デフォルトは "0"。
- (-yoffset | -yo) yoffset
- 鉛直方向のオフセット(調整値)デフォルトは "0"。
- -color color
- 文字色。デフォルトは "1"。
- -setfont size
- setfont.gs に与えるサイズ。
- -angle angle
- 文字の回転角[度]。デフォルトは "0"。
- string
- 描画する文字列。必ず最後の引数として指定する。
position, baseで設定可能な値
| 値 | 図又はpositionに対する位置 |
|---|---|
| tc | 中央・上 |
| bc | 中央・下 |
| tl | 左上 |
| bl | 左下 |
| tr | 右上 |
| br | 右下 |
| l | 左 |
| r | 右 |
使用例
(1) 図の左上に文字列"U[m/s]"を表示する
ga-> draws -pos tl U[m/s]
(2) 文字の大きさを指定して上に文字列"Temperature"を表示する
ga-> set strsiz 0.15 0.15
ga-> draws -pos tc Temperature
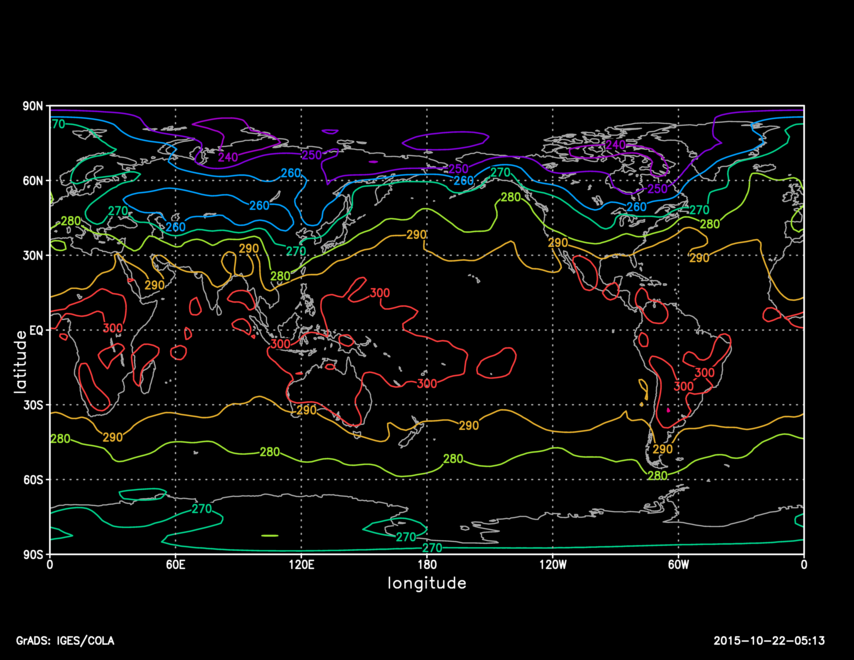
(3) 横軸と縦軸のラベルを表示する
ga-> d t
Contouring: 240 to 310 interval 10
ga-> draws -pos bc -yo -0.2 -setfont normal longitude
ga-> draws -pos l -xo -0.3 -setfont normal -angle 90 latitude
ga-> printim draws_sample3.eps

ソースコード
- draws.gs (必須)
- qgxinfo.gsf (必須)
- qw2xy.gsf (必須)
- qgr2xy.gsf (必須)
- setfont.gs (必要があれば)

